Slitting ROI Calculator: Estimate Your Annual Savings
See exactly how much OptiStack Pro can save your operation through reduced scrap, faster setups, and fewer quality claims.
Your Operation
Volume & Pricing
Setup Time
Operating Costs
Scrap & Quality
Your Potential Savings
Enter your numbers and click Calculate
How does this ROI calculation work?
The calculator adds up four separate savings and compares the total against the cost of the software. Nothing is hidden in a black box, and the arithmetic is worth understanding, because the size of the answer depends far more on your inputs than on the tool.
Scrap. Your annual tonnage multiplied by price per ton gives the material value flowing through the line. Your current scrap percentage of that is what you are throwing away today. The saving is the share of that scrap the calculator assumes you recover.
Setup labour. Setups per day multiplied by 250 working days gives setups per year. Multiplied by your minutes per setup, that is the hours per year spent changing over. Multiplied by your labour rate, that is what those hours cost in wages.
Line downtime. The same recovered hours, valued at your line cost per hour instead. This is usually the largest single component, because a slitting line standing idle costs far more per hour than the crew standing next to it.
Quality claims. Claims per year multiplied by average claim cost, reduced by the share the calculator assumes better setup control prevents.
What does this calculator assume?
Three improvement rates are built into the tool rather than entered by you, and you should see them before you trust the total:
- Setup time falls to 35% of your current figure, a 65% reduction.
- Scrap falls by 40% of your current rate, not to 40%.
- Quality claims fall by 60%.
- The line runs 250 setup days per year, and the software costs 79 per month.
These are assumptions, not measurements from your plant, and they are the right things to argue with. If your changeovers are already tightly run, a 65% reduction is optimistic and you should mentally halve the labour and downtime lines. If your setup process is entirely manual and undocumented, the same figure may be conservative. The honest way to use this tool is to treat the output as the size of the prize if the assumptions hold, then discount it by how much you believe them.
A worked example using the default figures
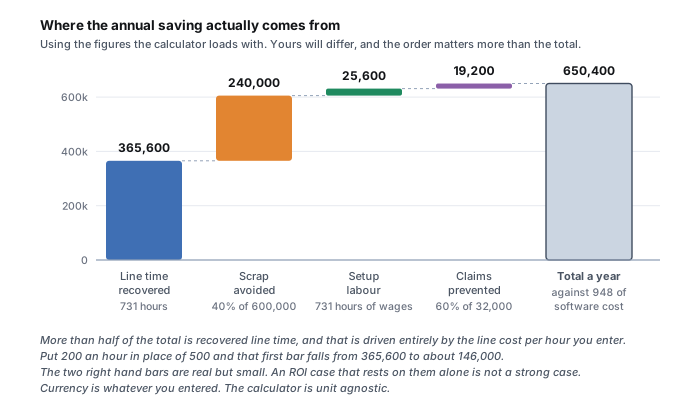
The calculator loads with 25,000 tons a year at 800 per ton, six setups a day at 45 minutes each, labour at 35 an hour, a line valued at 500 an hour, a 3% scrap rate, and four quality claims a year at 8,000 each. That produces:
- Material value: 25,000 × 800 = 20,000,000 a year.
- Current scrap: 3% of that = 600,000. A 40% reduction saves 240,000.
- Setup hours: 6 × 250 = 1,500 setups, at 45 minutes = 1,125 hours a year. Cutting to 15.75 minutes leaves 394 hours, recovering roughly 731 hours.
- Labour on those hours: 731 × 35 = about 25,600.
- Line time on those hours: 731 × 500 = about 365,600.
- Claims: 4 × 8,000 = 32,000, reduced by 60% = 19,200.
Total: roughly 650,000 a year. Look at where it comes from. More than half is recovered line time, and that figure is entirely driven by the line cost per hour you typed in. If your line is worth 200 an hour rather than 500, that component drops from 365,000 to 146,000 and the headline total falls by a third. The number is not wrong, but it is a statement about your line, not about the software.
Which inputs deserve the most care?
Line cost per hour. The most influential input and the one most often guessed. Use the contribution margin the line generates per running hour when it is sold out, not an accounting overhead rate. If the line is not capacity constrained, recovered hours do not convert to money at anything like the same rate, and this component should be discounted heavily.
Current setup minutes. Measure it rather than recalling it, and measure from last coil out to first good strip on the next job, not from when the crew starts turning wrenches. The gap between those two definitions is usually large.
Current scrap rate. Include edge trim you did not plan for and material lost to trial cuts at changeover, not just rejected coils. Setup driven scrap is the part optimisation can actually address.
Setups per day. Operations running many short jobs have far more to gain than operations running long campaigns, because every saving in the setup and scrap lines scales with changeover count.
What this calculator leaves out
It ignores implementation effort. Getting a real spacer and knife inventory into any system takes time, and until that inventory is accurate the calculated setups will not assemble. It ignores training, and it ignores the fact that savings arrive gradually rather than on day one.
It also assumes the improvements are independent and simply add up, which overstates the total slightly. Faster setups and lower scrap share a common cause, so some of what is counted in the scrap line and some of what is counted in the downtime line are the same underlying gain viewed twice.
Treat the result as a range and a direction rather than a forecast. If the number is large enough to matter even after you have halved it, the case is worth testing on your own line. If it only works at the default assumptions, it probably does not. To see where the setup time actually goes, read how to reduce slitting setup time, and for the scrap side, the reduce slitting scrap guide covers where the material is really lost.
Trusted by Steel Service Centers Worldwide
Real results from real customers
40%
Average Scrap Reduction
Across all customer operations
65%
Faster Setup Times
From calculation to production
10-50x
Typical ROI
In the first year
ROI Questions Answered
Start Saving Today
Join steel service centers saving thousands every month with optimized slitting setups. No credit card required for your 14-day free trial.